Student Achievement
The following is a collection of data on Howard University student outcomes.
Career & Achievement Metrics
Placement & Employment
The report for AY 24-25 that captures post-graduation plans for Howard University graduates (Undergraduate Students and Graduate/Professional Students) can be found below.
Performance on Licensing Exams
Please see individual program websites for licensure exam performance data.
Student Academic Outcomes
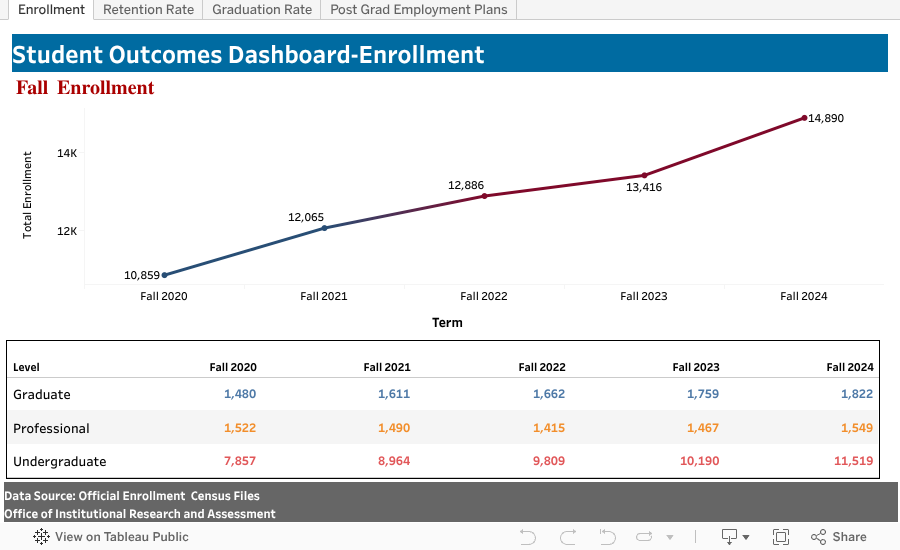
12-month Enrollment
Total 12-Month Unduplicated Headcount Enrollment
| Academic Year | Undergraduate Student Unduplicated Headcount | Graduate Student Unduplicated Headcount | Professional Student Unduplicated Headcount | Total 12-Month Unduplicated Headcount |
|---|---|---|---|---|
| 2020-21 | 8,427 | 1,663 | 1,543 | 11,633 |
| 2021-22 | 9,530 | 1,814 | 1,513 | 12,857 |
| 2022-23 | 10,531 | 1,858 | 1,472 | 13,861 |
| 2023-24 | 11,087 | 2,047 | 1,497 | 14,631 |
| 2024-25 | 13,017 | 2,059 | 1,570 | 16,646 |
Note: The number of students enrolled for credit at the close of the official add/drop period for each program.
Unduplicated 12-month enrollment counts each student only once during the 12-month period.
Total 12-Month Full-Time Equivalent (FTE) Student Enrollment - IPEDS Defined
| Academic Year | Undergraduate Student FTE Enrollment | Graduate Student FTE Enrollment | Doctor's-Professional Practice FTE Enrollment | Total 12-Month Full-Time Equivalent (FTE) Enrollment |
|---|---|---|---|---|
| 2020-21 | 8,136 | 1,246 | 1,463 | 10,845 |
| 2021-22 | 8,920 | 1,366 | 1,421 | 11,707 |
| 2022-23 | 9,810 | 1,451 | 1,370 | 12,631 |
| 2023-24 | 10,316 | 1,596 | 1,418 | 13,330 |
| 2024-25 | 10,863 | 1,613 | 1,337 | 13,813 |
Note: The number of FTE students is calculated based on the credit hours reported by the institution.
- Undergraduate FTE equals: Total annual UG credit hours ÷ 30
- Graduate FTE equals: Total annual GR credit hours ÷ 24
- Professional practice FTE equals: Total annual PR credits hours ÷ 41
The total 12-month FTE is generated by summing the reported undergraduate FTE, reported graduate FTE, and reported Doctor's Professional Practice FTE.
Retention Rates
Undergraduate First Time in College Retention Rates
| Cohort Term | Retention Rate |
|---|---|
| Fall 2020 | 91% |
| Fall 2021 | 89% |
| Fall 2022 | 90% |
| Fall 2023 | 91% |
| Fall 2024 | 88% |
Graduation Rates
Undergraduate University Graduation Rate
| Cohort | 4-Year | 6-Year | 8-Year |
|---|---|---|---|
| Fall 2014 | 52% | 64% | 65% |
| Fall 2015 | 53% | 64% | 65% |
| Fall 2016 | 61% | 70% | 71% |
| Fall 2017 | 60% | 69% | 70% |
| Fall 2018 | 60% | 70% | |
| Fall 2019 | 62% | 74% | |
| Fall 2020 | 63% |
Completions
2024-25 All Completions
| School/College | Award Level | Degrees Awarded | Count of Students |
|---|---|---|---|
| Cathy Hughes School of Communications | Bachelor's degree | 263 | 263 |
| Master's degree | 14 | 14 | |
| Chadwick A. Boseman College of Fine Arts | Bachelor's degree | 103 | 103 |
| Master's degree | 3 | 3 | |
| College of Arts & Sciences | Bachelor's degree | 1,008 | 973 |
| College of Dentistry | Post-Master's certificates | 1 | 1 |
| Doctor's degree - professional practice | 74 | 74 | |
| College of Engineering & Architecture | Bachelor's degree | 220 | 220 |
| Master's degree | 25 | 25 | |
| College of Medicine | Doctor's degree - professional practice | 110 | 110 |
| College of Nursing & Allied Health Sciences | Bachelor's degree | 291 | 288 |
| Master's degree | 3 | 3 | |
| Doctor's degree - professional practice | 30 | 30 | |
| College of Pharmacy | Doctor's degree - professional practice | 50 | 50 |
| Graduate School | Post-Master's certificates | 7 | 7 |
| Master's degree | 64 | 62 | |
| Doctor's degree - professional practice | 1 | 1 | |
| Doctor's degree - research / scholarship | 89 | 89 | |
| Post-Graduate Dental Program | Post-Master's certificates | 15 | 15 |
| School of Business | Bachelor's degree | 351 | 351 |
| Master's degree | 94 | 94 | |
| School of Divinity | Master's degree | 23 | 19 |
| Doctor's degree - professional practice | 8 | 8 | |
| School of Education | Bachelor's degree | 30 | 30 |
| Master's degree | 8 | 8 | |
| Doctor's degree - research / scholarship | 7 | 7 | |
| School of Law | Master's degree | 2 | 2 |
| Doctor's degree - professional practice | 160 | 160 | |
| School of Social Work | Master's degree | 167 | 167 |
| Grand Total | 3,221 | 3,163 |
2024-25 Completions by Award Level
| Award Level | Degrees Awarded | Count of Students |
|---|---|---|
| Bachelor's degree | 2,266 | 2,228 |
| Master's degree | 403 | 395 |
| Post-master's certificates | 23 | 23 |
| Doctor's degree - professional practice | 433 | 433 |
| Doctor's degree - research / scholarship | 96 | 96 |
| Grand Total | 3,221 | 3,163 |
2024-25 Completions by School/College
| School/College | Degrees Awarded | Count of Students |
|---|---|---|
| Cathy Hughes School of Communications | 277 | 277 |
| Chadwick A. Boseman College of Fine Arts | 106 | 106 |
| College of Arts & Sciences | 1,008 | 973 |
| College of Dentistry | 75 | 75 |
| College of Engineering & Architecture | 245 | 245 |
| College of Medicine | 110 | 110 |
| College of Nursing & Allied Health Sciences | 324 | 321 |
| College of Pharmacy | 50 | 50 |
| Graduate School | 161 | 159 |
| Post-Graduate Dental Program | 15 | 15 |
| School of Business | 445 | 445 |
| School of Divinity | 31 | 27 |
| School of Education | 45 | 45 |
| School of Law | 162 | 162 |
| School of Social Work | 167 | 167 |
| Grand Total | 3,221 | 3,163 |
Average Time to Degree (in years) by Academic Level
Undergraduate
| College | 2022-23 | 2023-24 | 2024-25 |
|---|---|---|---|
| Cathy Hughes School of Communications | 4 | 4 | 4 |
| Chadwick A. Boseman College of Fine Arts | 4 | 4 | 4 |
| College of Arts & Sciences | 4 | 4 | 4 |
| College of Engineering & Architecture | 4 | 4 | 4 |
| College of Nursing & Allied Health Sciences | 4 | 4 | 4 |
| School of Business | 4 | 4 | 4 |
| School of Education | 4 | 4 | 4 |
Graduate
| College | 2022-23 | 2023-24 | 2024-25 |
|---|---|---|---|
| College of Arts & Sciences | 5 | ||
| Cathy Hughes School of Communications | 3 | 4 | 3 |
| Chadwick A. Boseman College of Fine Arts | 2 | 3 | 2 |
| College of Engineering & Architecture | 5 | 5 | |
| College of Nursing & Allied Health Sciences | 3 | 3 | 3 |
| Graduate School | 4 | 5 | 4 |
| School of Business | 2 | 2 | 2 |
| School of Divinity | 4 | 3 | 4 |
| School of Education | 3 | 4 | 5 |
| School of Law | 1 | ||
| School of Social Work | 2 | 2 | 2 |
Professional
| College | 2022-23 | 2023-24 | 2024-25 |
|---|---|---|---|
| College of Dentistry | 4 | 4 | 4 |
| College of Medicine | 4 | 4 | 4 |
| College of Pharmacy | 4 | 4 | 4 |
| School of Law | 3 | 3 | 3 |