Get a snapshot of who’s on campus this fall. Our Fall Enrollment Dashboard breaks down student headcounts, demographics, and trends to give a clear view of our evolving student body.
Discover who’s enrolled this spring. The Spring Enrollment Dashboard highlights student counts, demographics, and key trends to keep you informed about our campus community.
From applications to admissions — explore the journey. Our Admissions Dashboard offers insights into applicant trends, acceptance rates, and incoming class profiles to support strategic planning and outreach.
Get to know the people behind the programs. Our Faculty Dashboard provides data on faculty demographics, ranks, and trends — offering a clear view of the academic backbone of our institution.
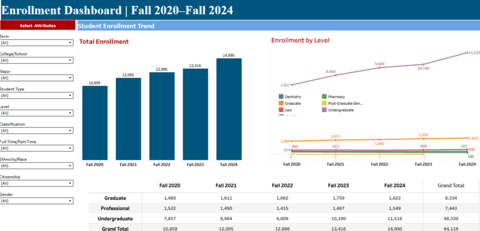
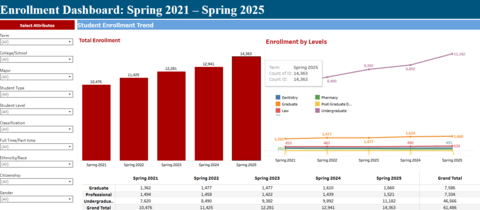
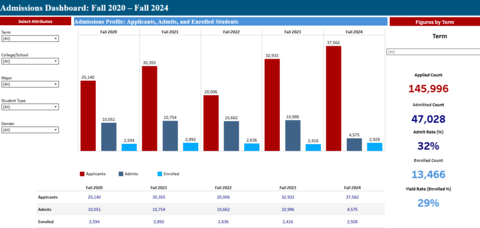
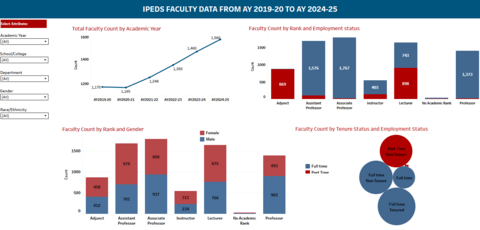
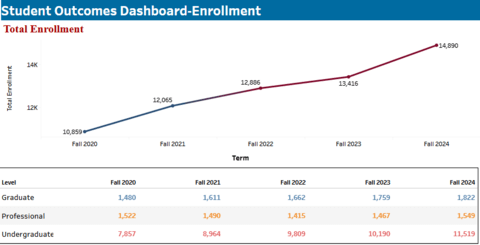
Our Student Outcomes dashboard reflects a commitment to quality and continuous improvement. This section provides key documents and data supporting our institutional effectiveness and accountability, including total enrollment, retention, and graduation rates.