Student Achievement
The following is a collection of data on Howard University student outcomes.
Career & Achievement Metrics
The report for AY 24-25 that captures post-graduation plans for Howard University graduates (Undergraduate Students and Graduate/Professional Students) can be found below.
Please see individual program websites for licensure exam performance data.
Student Academic Outcomes
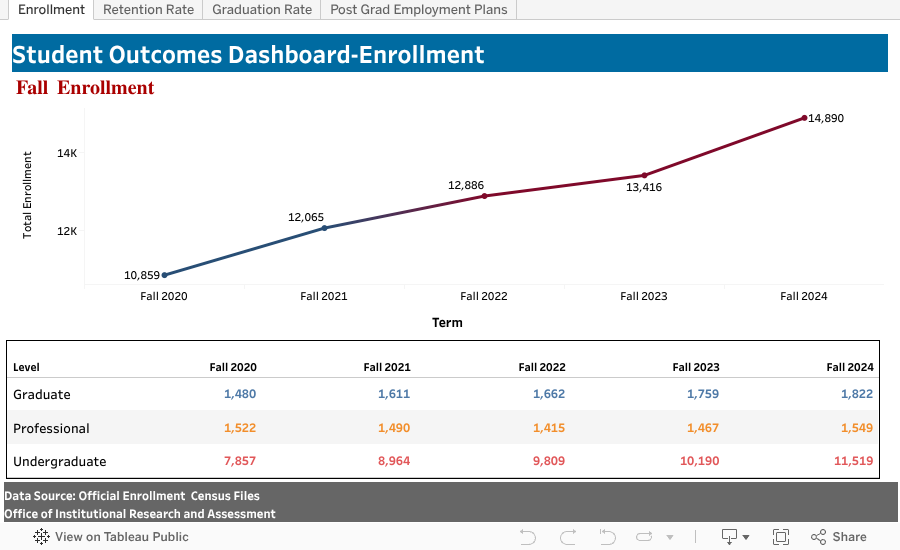
12-month Enrollment
Total 12-Month Unduplicated Headcount Enrollment
| Academic Year | Undergraduate Student Unduplicated Headcount | Graduate Student Unduplicated Headcount | Professional Student Unduplicated Headcount | Total 12-Month Unduplicated Headcount |
|---|---|---|---|---|
| 2020-21 | 8,427 | 1,663 | 1,543 | 11,633 |
| 2021-22 | 9,530 | 1,814 | 1,513 | 12,857 |
| 2022-23 | 10,531 | 1,858 | 1,472 | 13,861 |
| 2023-24 | 11,087 | 2,047 | 1,497 | 14,631 |
| 2024-25 | 13,017 | 2,059 | 1,570 | 16,646 |
Note: The number of students enrolled for credit at the close of the official add/drop period for each program.
Unduplicated 12-month enrollment counts each student only once during the 12-month period.
Total 12-Month Full-Time Equivalent (FTE) Student Enrollment - IPEDS Defined
| Academic Year | Undergraduate Student FTE Enrollment | Graduate Student FTE Enrollment | Doctor's-Professional Practice FTE Enrollment | Total 12-Month Full-Time Equivalent (FTE) Enrollment |
|---|---|---|---|---|
| 2020-21 | 8,136 | 1,246 | 1,463 | 10,845 |
| 2021-22 | 8,920 | 1,366 | 1,421 | 11,707 |
| 2022-23 | 9,810 | 1,451 | 1,370 | 12,631 |
| 2023-24 | 10,316 | 1,596 | 1,418 | 13,330 |
| 2024-25 | 10,863 | 1,613 | 1,337 | 13,813 |
Note: The number of FTE students is calculated based on the credit hours reported by the institution.
- Undergraduate FTE equals: Total annual UG credit hours ÷ 30
- Graduate FTE equals: Total annual GR credit hours ÷ 24
- Professional practice FTE equals: Total annual PR credits hours ÷ 41
The total 12-month FTE is generated by summing the reported undergraduate FTE, reported graduate FTE, and reported Doctor's Professional Practice FTE.
Fall Full-Time Equivalent (FTE) Student Enrollment - University Defined
| Academic Period | Undergraduate Student FTE Enrollment | Graduate Student FTE Enrollment | Doctor's-Professional Practice FTE Enrollment | Total 12-Month Full-Time Equivalent (FTE) Enrollment |
|---|---|---|---|---|
| Fall 2021 | 8,601 | 1,318 | 1,474 | 11,392 |
| Fall 2022 | 9,284 | 1,325 | 1,386 | 11,995 |
| Fall 2023 | 9,637 | 1,410 | 1,464 | 12,512 |
| Fall 2024 | 10,430 | 1,461 | 1,548 | 13,438 |
| Fall 2025 | 10,053 | 1,436 | 1,554 | 13,043 |
Note: The number of FTE students is calculated based on the enrollment load status reported by the institution.
- Undergraduate, Graduate, and Professional FTE equals: Total number of students enrolled full time plus one-third part time.
The total Fall FTE is generated by summing the reported undergraduate FTE, reported graduate FTE, and reported Doctor's Professional Practice FTE.
Retention Rates
Undergraduate First Time in College Retention Rates
| Cohort Term | Retention Rate |
|---|---|
| Fall 2020 | 91% |
| Fall 2021 | 88% |
| Fall 2022 | 90% |
| Fall 2023 | 91% |
| Fall 2024 | 88% |
Graduation Rates
Undergraduate University Graduation Rate
| Cohort | 4-Year | 6-Year | 8-Year |
|---|---|---|---|
| Fall 2014 | 52% | 64% | 65% |
| Fall 2015 | 53% | 64% | 65% |
| Fall 2016 | 61% | 70% | 71% |
| Fall 2017 | 60% | 69% | 70% |
| Fall 2018 | 60% | 70% | |
| Fall 2019 | 62% | 74% | |
| Fall 2020 | 63% |
Completions
2024-25 All Completions
| School/College | Award Level | Degrees Awarded | Count of Students |
|---|---|---|---|
| Cathy Hughes School of Communications | Bachelor's degree | 263 | 263 |
| Master's degree | 14 | 14 | |
| Chadwick A. Boseman College of Fine Arts | Bachelor's degree | 103 | 103 |
| Master's degree | 3 | 3 | |
| College of Arts & Sciences | Bachelor's degree | 1,008 | 973 |
| College of Dentistry | Post-Master's certificates | 1 | 1 |
| Doctor's degree - professional practice | 74 | 74 | |
| College of Engineering & Architecture | Bachelor's degree | 220 | 220 |
| Master's degree | 25 | 25 | |
| College of Medicine | Doctor's degree - professional practice | 110 | 110 |
| College of Nursing & Allied Health Sciences | Bachelor's degree | 291 | 288 |
| Master's degree | 3 | 3 | |
| Doctor's degree - professional practice | 30 | 30 | |
| College of Pharmacy | Doctor's degree - professional practice | 50 | 50 |
| Graduate School | Post-Master's certificates | 7 | 7 |
| Master's degree | 64 | 62 | |
| Doctor's degree - professional practice | 1 | 1 | |
| Doctor's degree - research / scholarship | 89 | 89 | |
| Post-Graduate Dental Program | Post-Master's certificates | 15 | 15 |
| School of Business | Bachelor's degree | 351 | 351 |
| Master's degree | 94 | 94 | |
| School of Divinity | Master's degree | 23 | 19 |
| Doctor's degree - professional practice | 8 | 8 | |
| School of Education | Bachelor's degree | 30 | 30 |
| Master's degree | 8 | 8 | |
| Doctor's degree - research / scholarship | 7 | 7 | |
| School of Law | Master's degree | 2 | 2 |
| Doctor's degree - professional practice | 160 | 160 | |
| School of Social Work | Master's degree | 167 | 167 |
| Grand Total | 3,221 | 3,163 |
2024-25 Completions by Award Level
| Award Level | Degrees Awarded | Count of Students |
|---|---|---|
| Bachelor's degree | 2,266 | 2,228 |
| Master's degree | 403 | 395 |
| Post-master's certificates | 23 | 23 |
| Doctor's degree - professional practice | 433 | 433 |
| Doctor's degree - research / scholarship | 96 | 96 |
| Grand Total | 3,221 | 3,163 |
2024-25 Completions by School/College
| School/College | Degrees Awarded | Count of Students |
|---|---|---|
| Cathy Hughes School of Communications | 277 | 277 |
| Chadwick A. Boseman College of Fine Arts | 106 | 106 |
| College of Arts & Sciences | 1,008 | 973 |
| College of Dentistry | 75 | 75 |
| College of Engineering & Architecture | 245 | 245 |
| College of Medicine | 110 | 110 |
| College of Nursing & Allied Health Sciences | 324 | 321 |
| College of Pharmacy | 50 | 50 |
| Graduate School | 161 | 159 |
| Post-Graduate Dental Program | 15 | 15 |
| School of Business | 445 | 445 |
| School of Divinity | 31 | 27 |
| School of Education | 45 | 45 |
| School of Law | 162 | 162 |
| School of Social Work | 167 | 167 |
| Grand Total | 3,221 | 3,163 |
Average Time to Degree (in years) by Academic Level
Undergraduate
| College | 2022-23 | 2023-24 | 2024-25 |
|---|---|---|---|
| Cathy Hughes School of Communications | 4 | 4 | 4 |
| Chadwick A. Boseman College of Fine Arts | 4 | 4 | 4 |
| College of Arts & Sciences | 4 | 4 | 4 |
| College of Engineering & Architecture | 4 | 4 | 4 |
| College of Nursing & Allied Health Sciences | 4 | 4 | 4 |
| School of Business | 4 | 4 | 4 |
| School of Education | 4 | 4 | 4 |
Graduate
| College | 2022-23 | 2023-24 | 2024-25 |
|---|---|---|---|
| College of Arts & Sciences | 5 | ||
| Cathy Hughes School of Communications | 3 | 4 | 3 |
| Chadwick A. Boseman College of Fine Arts | 2 | 3 | 2 |
| College of Engineering & Architecture | 5 | 5 | |
| College of Nursing & Allied Health Sciences | 3 | 3 | 3 |
| Graduate School | 4 | 5 | 4 |
| School of Business | 2 | 2 | 2 |
| School of Divinity | 4 | 3 | 4 |
| School of Education | 3 | 4 | 5 |
| School of Law | 1 | ||
| School of Social Work | 2 | 2 | 2 |
Professional
| College | 2022-23 | 2023-24 | 2024-25 |
|---|---|---|---|
| College of Dentistry | 4 | 4 | 4 |
| College of Medicine | 4 | 4 | 4 |
| College of Pharmacy | 4 | 4 | 4 |
| School of Law | 3 | 3 | 3 |